Tailscale-only · Zero inbound ports · No Node.js

Your homelab,
one console.

Observe services, SLOs, backup freshness and container health across up to five rootless Podman nodes — then open the correct container or host shell without exposing a single admin port.

Move your cursor — the grid responds.

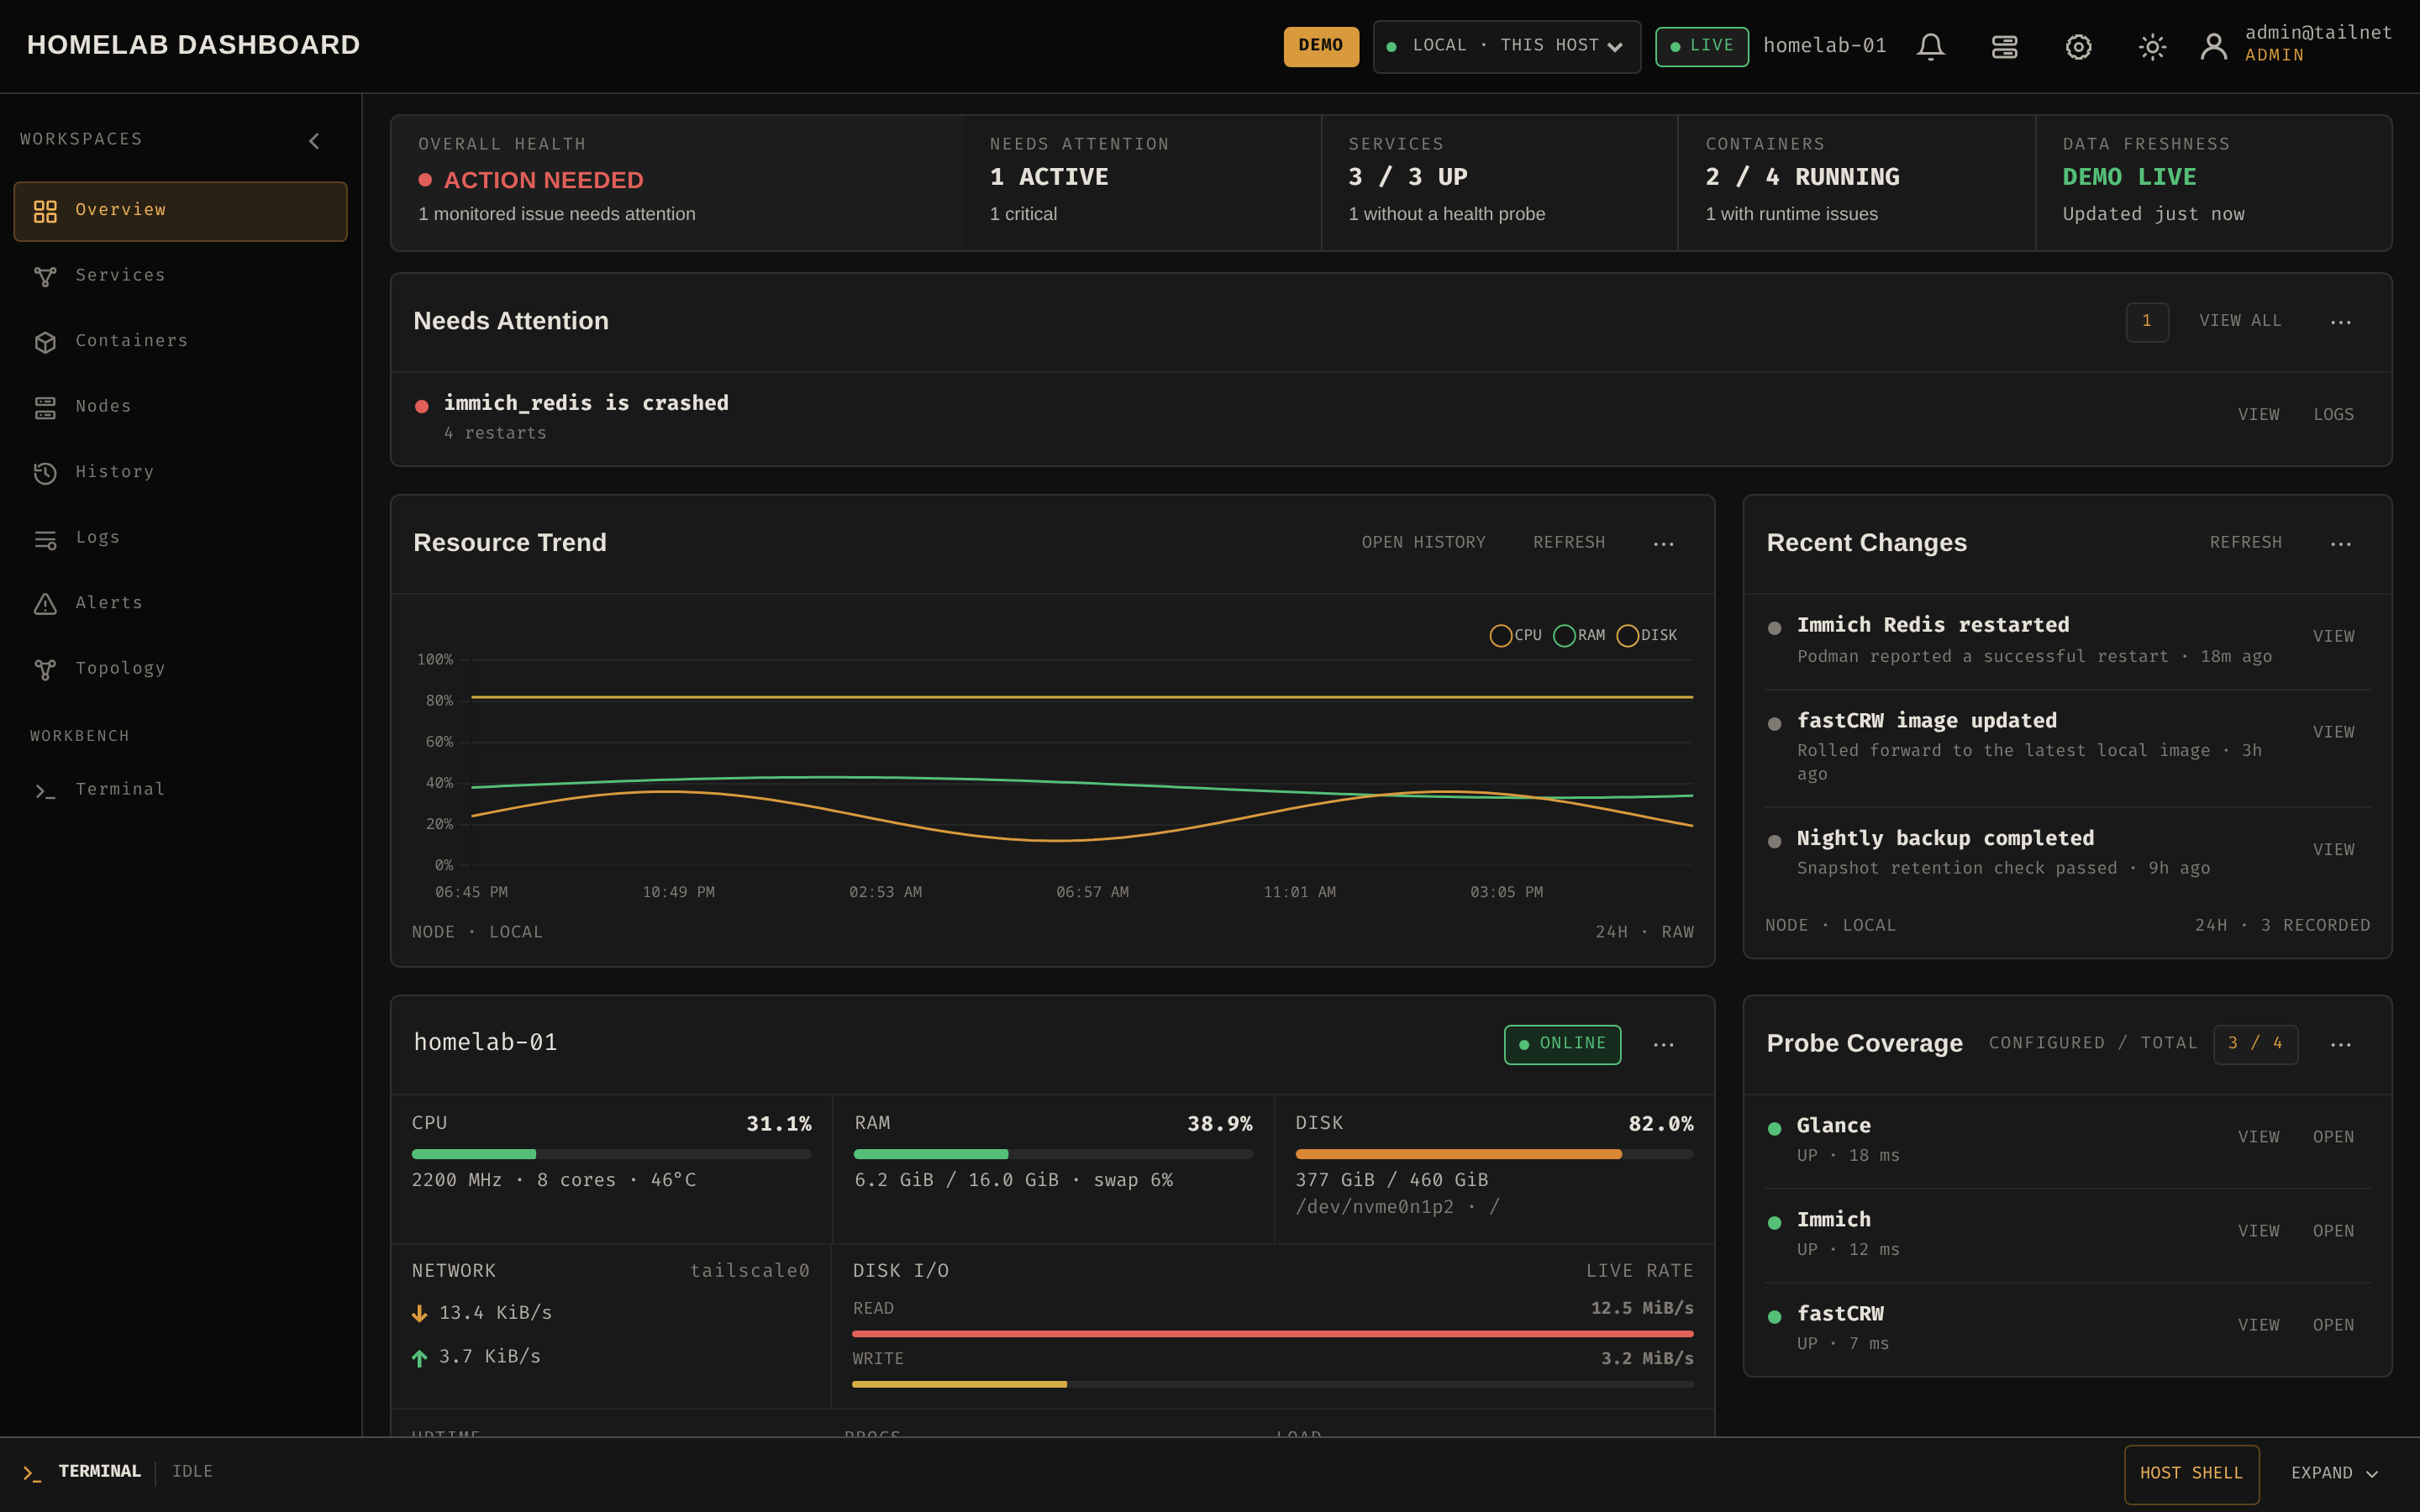
HostDeck overview — live health, host metrics and 24-hour trend
LIVE · overview · admin@tailnet
0workspaces
0static binaries
0inbound ports
0RSS per node

Observe. Act. Retain. Trust.

The four commitments of an operations console — each one implemented in code, not slides.

Observe

Host CPU, memory, disk, network, load and temperature; container health and resource usage; TLS certificate observations; service uptime and backup freshness — live and as 90-day history.

Act

Container logs with regex search, interactive container shells, and an explicitly confirmed host Bash — context-linked to the alert or log that sent you there.

Retain

Tiered history in one SQLite file: 10-second samples for 48h, rolled up to 1-minute for 30 days and 15-minute for 90 days. Configurable quota, no TSDB.

Trust

Your Tailscale identity is the auth plane — no passwords, no exposed admin panel. Identity headers trusted only from loopback; sessions, mutations and shells carry CSRF and same-origin guards.

SLOs

Per-service availability objectives with 7/30/90-day windows and explicit error budgets. Degraded states are flagged, not hidden.

Topology

Curate service-to-service dependencies and see the blast radius of a failing service at a glance.

Three binaries. One SQLite file. Zero ports to open.

No Node.js, no reverse proxy, no metrics exporters — the whole console is two processes talking over a Unix socket, plus one outbound-only agent per remote node.

01

Dashboard

A single static Go binary serves the UI and reads and writes one SQLite file. Configurable history quota, no TSDB.

02

Host agent

The same binary, in agent mode, talks to the dashboard over a local Unix socket. No TCP listener — nothing to port-forward.

03

Remote nodes

One binary per node, installed unprivileged, dials out to your tailnet over WSS. It never listens, so there is no inbound surface.

Everything runs rootless. Your Tailscale login is the only password.

From zero to your first shell in three commands.

  1. 01

    Install

    One command, unprivileged, APT/DNF/Pacman aware. It enables the rootless Podman socket, installs the host agent and starts Compose.

  2. 02

    Join the tailnet

    Tailscale Serve terminates HTTPS for the dashboard — no host port is ever published.

  3. 03

    Open the console

    Browse to your *.ts.net URL, log in with your tailnet identity, and start observing.

install.sh

Run it in your browser. No account, no install.

The full operator workflow with deterministic mock data — try regex log search, open a container shell, toggle the light theme.

LIVE · no loginhostdeck › demo

Eight workspaces. One loop: see → understand → act.

Everything an operator runs on a 1–5 node lab, in one interface — no tab sprawl between metrics, logs and shells.
Services workspace with per-service SLO error budgets
ServicesSLO error budgets · 7/30/90-day windows
Service topology showing curated dependencies
TopologyCurated dependency map · blast radius
Logs workspace with regex search
LogsFollow · pause · regex search
Terminal workbench with an interactive host shell
TerminalContainer shells · host Bash

How it stacks against the usual homelab stack.

The full feature matrix with honest "we don't do this" notes lives in docs/comparison.md.

FeatureHostDeckStart pagesUptime KumaBeszel / NetdataGrafana stack
Zero inbound portsNativePartial · outbound WS
SLO error budgets 7/30/90dFirst-partyPartial · uptime % onlyPartial · needs plugin
Backup freshness monitoringFirst-partyPartial · diff mechanismPartial · hand-rolled
90-day SQLite history, no PrometheusNativePartial · status pagesPartial · basic ~30dYes · but heavy
Interactive container shellNative
Confirmed host BashNativePartial · Cockpit-like
Tailscale identity = sole authNative

Alerts reach you — not just a badge.

Two native delivery channels, no vendor SDKs: ntfy push and an HMAC-signed generic webhook. Point the webhook at anything that speaks HTTP — a Telegram bot, Discord, Slack, Home Assistant, n8n — and alerts land where you already look.

ntfy push HMAC-SHA256 webhook Telegram · Discord · Slack · Home Assistant · n8n · any webhook endpoint

Signed payloads with X-Homelab-Signature: sha256=<hex> · per-webhook secrets · in-UI test push and test POST · ack and silence rules. Setup in docs/operations.md.

Small surface. Explicit actions. No inbound ports.

The host shell is the most trusted feature, so it gets the most guards — and the whole system is designed so there is nothing to port-forward.

Tailnet identity = auth

No password database. Viewer vs admin comes from your Tailscale login; identity headers are only trusted when the request's peer is loopback.

Zero inbound ports

Local host access goes through a Unix-socket agent; remote nodes dial out over Tailscale WSS. No SSH, no agent listener, no reverse proxy to secure.

Host shell is guarded

An explicit HOST_SHELL_USERS allowlist plus an in-UI confirmation. Session audit records, 15-minute idle timeout, 1-hour hard cap — never auto-resumed.

Least privilege by build

Dashboard runs read-only with dropped capabilities; host and node agents run as the unprivileged installing account. Three binaries, three privilege boundaries.

Fair questions, straight answers.

Do I need Tailscale?

Yes — your tailnet identity is the auth plane, so there is no password database to secure. Tailscale's free tier covers a personal tailnet with 100 devices.

How much does it cost?

Nothing. Apache-2.0, one static Go binary, one SQLite file. No SaaS, no licence keys, no telemetry.

Does it work with Docker, or only Podman?

Container health, stats, logs and shells are built against the rootless Podman socket. If you run Docker, the container workspaces won't have a socket to talk to.

How is this different from Grafana, Beszel or Uptime Kuma?

Those are point tools — metrics, monitoring or availability. This console closes the loop: see the alert, open the right log, drop into the right shell, all in one place, with zero inbound ports. See the full comparison.

Can I get alerts on Telegram, Discord or Slack?

Yes — via the HMAC-signed webhook channel. The dashboard POSTs a versioned JSON payload to any HTTPS endpoint, so you forward it to your own bot, n8n flow or Home Assistant automation. Native ntfy push is also built in; we deliberately ship two channels instead of fifty SDKs.

Where does my data live?

One SQLite file on the dashboard host. History is rolled up in three tiers — 10s samples for 48h, 1-minute for 30 days, 15-minute for 90 days — with a configurable quota.

Docs that answer the real questions.

No marketing fluff — operational detail, architecture decisions, honest comparisons and measured numbers, all in the repository.

Operations guide Install, run, upgrade and day-to-day ops for the console and agents. Architecture decisions Why zero inbound ports, why Unix sockets, why SQLite, why Tailscale-only. Comparison matrix Feature-by-feature against Homepage, Uptime Kuma, Beszel, Grafana and more. Benchmarks Memory, CPU and history footprint measured on a real deployment. Migration guide Moving from Homepage, Uptime Kuma or a hand-rolled script stack. Changelog Every release since the first commit, in Keep a Changelog format.

Your homelab, one console.

Not a bookmark grid, not a Grafana stack, not a container manager — the loop between them. Compare feature-by-feature against Homepage, Uptime Kuma, Beszel, Portainer and more.

Try the live demo GitHub ↗ Compare with the field